Software for Windows
Science with your Sound Card!


Features:
Oscilloscope
Spectrum Analyzer
8-Channel
Signal Generator
(Absolutely FREE!)
Spectrogram
Pitch Tracker
Pitch-to-MIDI
DaqMusiq Generator
(Free Music... Forever!)
Engine Simulator
LCR Meter
Remote Operation
DC Measurements
True RMS Voltmeter
Sound Level Meter
Frequency Counter
Period
Event
Spectral Event
Temperature
Pressure
MHz Frequencies
Data Logger
Waveform Averager
Histogram
Post-Stimulus Time
Histogram (PSTH)
THD Meter
IMD Meter
Precision Phase Meter
Pulse Meter
Macro System
Multi-Trace Arrays
Trigger Controls
Auto-Calibration
Spectral Peak Track
Spectrum Limit Testing
Direct-to-Disk Recording
Accessibility
Data Logger
Waveform Averager
Histogram
Post-Stimulus Time
Histogram (PSTH)
THD Meter
IMD Meter
Precision Phase Meter
Pulse Meter
Macro System
Multi-Trace Arrays
Trigger Controls
Auto-Calibration
Spectral Peak Track
Spectrum Limit Testing
Direct-to-Disk Recording
Accessibility
Applications:
Frequency response
Distortion measurement
Speech and music
Microphone calibration
Loudspeaker test
Auditory phenomena
Musical instrument tuning
Animal sound
Evoked potentials
Rotating machinery
Automotive
Product test
Contact us about
your application!
Sound Card Spectrogram / Pitch Track (Sgram/PT) Toggle
Macro: Sgram
The Sgram/PT button in the Daqarta toolbar toggles Spectrogram mode, or Pitch Track if that is active. You can also use ALT+M. Sgram/PT is automatically toggled off if Spectrum is toggled on, and vice-versa.
Spectrogram mode displays a "voiceprint", with frequency on the Y axis, time on the X axis, and intensity encoded as color. Here's an example from the Spectrogram (Voiceprint) Screen Images topic:
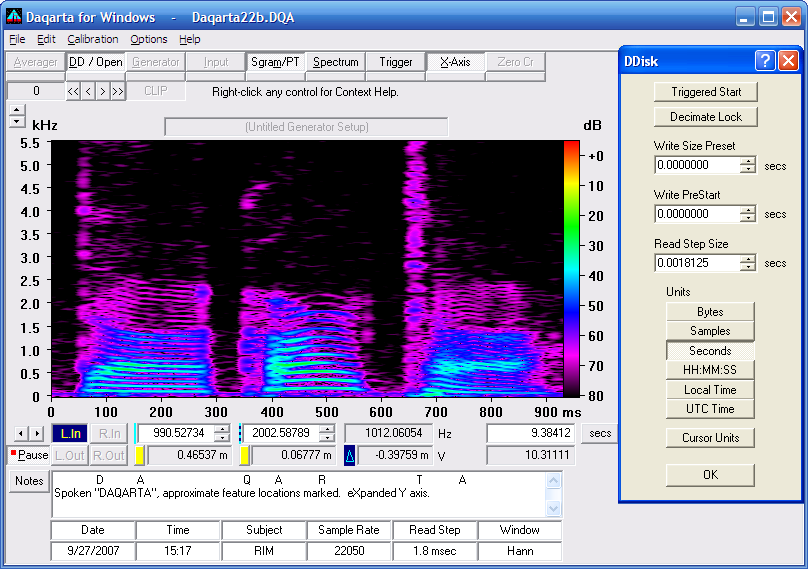
If you are new to spectrograms, it may help to consider that they are somewhat like standard sheet music: Higher notes are higher on the "page", and time flows from left to right.
Sheet music notes are in discrete semitone (logarithmic) steps, whereas spectrograms use many very fine linear frequency steps.
Sheet music uses a dot to indicate the location of a note in time and pitch, plus various sticks and bars on the dot to indicate the note duration. A spectrogram uses colored pixels to indicate tone locations; duration is indicated by multiple pixels in a connected time line.
Sheet music indicates loudness via text notation, whereas a spectrogram indicates loudness via color.
Unlike sheet music, a spectrogram also shows harmonics ("overtones") as parallel lines, and the loudness of each harmonic can be directly inferred from its color.
A big problem with learning to "read" a spectrogram is simply information overload, because unlike sheet music nothing is left to interpretation. Start by looking for the lowest bright line, which will typically be the fundamental. There will usually be equally-spaced parallel harmonic lines above it. Certain of the lower harmonics may be louder (brighter) than others, but there will be a general reduction in loudness at higher harmonics.
Noise is indicated by a speckled region without harmonic structure. A large vertical swath of noise will be seen at the start of a plosive or sibilant syllable in speech, for example.
The Spectrogram is produced by taking multiple individual spectra; each vertical column of pixels represents one Y-log spectrum "turned on edge", with the amplitude mapped as color. Typically, higher spectral peaks are encoded as brighter colors, but you can define the color scheme any way you choose. There are 256 colors available, which is enough to encode the 256 vertical pixels of normal Y-log Spectrum mode.
The color palette is the sequence of 256 colors chosen to map the levels from low to high. The palette may be created, modified, saved, or loaded from the Spectrogram Color Dialog, or via macro operations on arrays. The palette is only the set of colors, independent of the dB range that they represent.
For any given palette, the actual dB range covered is shown via a vertical color bar at the right end of the spectrogram. You can adjust this range larger or smaller with the PgUp and PgDn display magnification keys, in the same way that you can adjust the dB range of a normal Y-log Spectrum. Using CTRL with either Pg key moves in 1 dB steps, while using ALT moves in 1/16 dB steps.
You can also click on the little up and down arrows above the left Y axis; in Spectrogram mode they affect the dB mapping instead of the actual Y-axis variable, which here is frequency.
Also as with a normal Y-log Spectrum, you can use SHIFT with PgUp or PgDn (or the up and down buttons) to shift the range top reference to something other than the 0 dB default. You can likewise use CTRL or ALT with SHIFT plus either Pg key for 1 dB or 1/16 dB changes.
You can thus use PgDn to narrow the range (less total dB) and SHIFT+PgUp to slide this narrower range down to cover some small fraction of the total range to get a magnified view. SHIFT+Home will restore the original unshifted range top.
You can also use the mouse to drag the color bar to change ranges, and use it with the SHIFT key to change the range top reference.
Finally, you can directly enter specific dB values corresponding to the top and bottom palette colors into the upper and lower controls that are shown at the right of the color bar. (You may have to drag an overlying dialog aside to see these.) Always adjust the top control first, since that slides the overall range up or down and thereby changes the bottom value, but changing the bottom control doesn't affect the top.
The frequency range covered by the Y axis defaults to half the sample rate, just as for Spectrum mode. You can expand the view of a smaller portion by toggling the toolbar X-Axis button, or the eXpand button in the Spectrogram / Pitch Track control dialog, or the one in the X-Axis control dialog (which here control the Y axis of the spectrogram).
Alternatively, you can drag the spectrogram Y axis with the mouse. Dragging downward moves the dragged point on the axis down by increasing the maximum frequency shown, while dragging upward moves the dragged point up by decreasing the minimum frequency shown. To move the opposite ends, start dragging and without lifting the button reverse the drag direction.
Note that the scroll arrows at either end of the X-Axis actually control the Y axis of the spectrogram.
The time range covered by the true Spectrogram X axis depends upon the Trace Update rate and Trigger status. When you first toggle Sgram on, there is a slight delay before the X axis appears. Daqarta waits for the first few spectra to get an estimate for how long it will take to get all 512 spectra needed for a full Spectrogram screen, then it calibrates the X axis and shows it. This is only an estimate, since the actual update rate depends upon some unpredictable timings, particularly if Trigger is waiting for some erratic event.
When the Spectrogram is in progress, a vertical column of pixels is shown for each trace update. The way these are presented depends upon the Spectrogram Display Mode, which defaults to Scroll. In this mode new columns appear at the right edge of the display and scroll to the left.
In Scan mode, the vertical column starts at the left edge and writes over old data as it moves to the right, then wraps back to the left end and continues. A thin white column with black edges moves just ahead of the new data to help you to see the current position even on a busy display.
A new X-axis time calibration is done after every 512 columns have been shown; you may see the time values change. The values always assume a single 512-column Spectrogram starting from 0 time; they do not increase continually on successive wraps.
Bloom is a "special effects" display mode; no X axis is shown.
In general you probably will not want to have Trigger active in Spectrogram mode, since you will want to see as much of the signal as possible, and the whole point of triggered operation is to not show the signal until a trigger is found. With triggering, there will be a wait (possibly a long wait) before each vertical line is shown.
However, you can use the Single option in the Trigger dialog to cause the Spectrogram to wait for an initial trigger event, then run untriggered until it fills the display, whereupon it enters Pause mode and awaits the next Trig Arm press to start the next full display.
When Trigger is toggled off, the speed of the spectrogram (and hence the X-axis calibration) is controlled by the Trace Update Interval in the X-Axis Dialog. This sets the time between the individual spectra that make up Sgram vertical columns, so a smaller value means a faster spectrogram.
If you change the dB range or reference, or the eXpand state or Max/Min range, during a real-time Spectrogram, note that the changes only affect the current and future data; they do not affect the portion of the Spectrogram already on the screen.
Note that although there are no trace cursors visible in Sgram mode, the cursor readouts show the values that would be seen in Spectrum mode. (You can adjust them via the cursor keys or macros if you don't want to toggle back and forth to Spectrum mode.) The Sgram thus allows an overview of the signal in frequency and time, while the readouts still monitor real-time details.
Note that the Sgram will reflect any Spectrum Curve weighting that is currently active. That is only active if Spectrum Y-log mode is also active, just as when you are viewing the Spectrum, even though the Sgram always uses a dB-based range.
Macro Notes:
Sgram=1 activates Sgram mode, Sgram=0 restores waveform display mode, and Sgram=x toggles between them.
Sgram is disabled when a single-trace file is open; the Sgram macro command will abort with an error message.
See also Spectrogram / Pitch Track Controls, Spectrogram (Sgram) Color Palette Dialog, Spectrograms of File Data
- Back to Input dB Toggle
- Ahead to Spectrogram (Voiceprint) Screen Images
- Daqarta Help Contents
- Daqarta Help Index
- Daqarta Downloads
- Daqarta Home Page
- Purchase Daqarta
Questions? Comments? Contact us!
We respond to ALL inquiries, typically within 24 hrs.INTERSTELLAR RESEARCH:
Over 35 Years of Innovative Instrumentation
© Copyright 2007 - 2023 by Interstellar Research
All rights reserved