Software for Windows
Science with your Sound Card!


Features:
Oscilloscope
Spectrum Analyzer
8-Channel
Signal Generator
(Absolutely FREE!)
Spectrogram
Pitch Tracker
Pitch-to-MIDI
DaqMusiq Generator
(Free Music... Forever!)
Engine Simulator
LCR Meter
Remote Operation
DC Measurements
True RMS Voltmeter
Sound Level Meter
Frequency Counter
Period
Event
Spectral Event
Temperature
Pressure
MHz Frequencies
Data Logger
Waveform Averager
Histogram
Post-Stimulus Time
Histogram (PSTH)
THD Meter
IMD Meter
Precision Phase Meter
Pulse Meter
Macro System
Multi-Trace Arrays
Trigger Controls
Auto-Calibration
Spectral Peak Track
Spectrum Limit Testing
Direct-to-Disk Recording
Accessibility
Data Logger
Waveform Averager
Histogram
Post-Stimulus Time
Histogram (PSTH)
THD Meter
IMD Meter
Precision Phase Meter
Pulse Meter
Macro System
Multi-Trace Arrays
Trigger Controls
Auto-Calibration
Spectral Peak Track
Spectrum Limit Testing
Direct-to-Disk Recording
Accessibility
Applications:
Frequency response
Distortion measurement
Speech and music
Microphone calibration
Loudspeaker test
Auditory phenomena
Musical instrument tuning
Animal sound
Evoked potentials
Rotating machinery
Automotive
Product test
Contact us about
your application!
Spectrum Window Theory and Demonstration
The FFT function treats the N = 1024 samples that it receives as though they formed the basic unit of a repetitive waveform: It assumes that if we took more samples they would repeat exactly, with the (N + 1) sample being identical to the first sample, and so on. In other words, we should be able to reproduce that repetitive input by playing back our N samples, looping from the last sample back to the first, over and over continuously. In reality, this is only true if the input is a repeating waveform and its basic frequency is an exact multiple of the sample rate divided by N.
Real signals are rarely that cooperative. The usual case is that if our N samples start at one point in a signal waveform cycle, they end at some other point, so that if we really did play these back in a loop we would get a discontinuity or "glitch" between the last sample and the first.
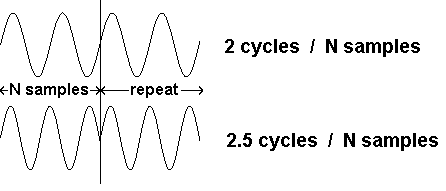
If the original signal was a pure sine wave, our replica would have a buzz added to it, and the bigger the discontinuity, the louder the buzz would sound. The buzz would have a frequency of the sample rate divided by N, which would not be a harmonic of the input wave and would thus sound very bad.
And this is exactly what the FFT spectrum shows. Try this with the Daqarta Generator: Set a sine wave to show an exact integer number of cycles on the waveform display, and toggle on the Spectrum display. You will see a single line at the sine wave frequency if you tuned things just right. Toggle Y-log on to get a better view of the lower levels.
Now adjust the frequency slowly and watch the leakage "skirts" of the peak broaden as you move farther from the optimum value, then drop back down again as you get nearer to the next integer number of cycles... which you can verify by toggling Spectrum back off to see the waveform. Set the frequency so that the waveform ends on a positive or negative peak, and when you view the Spectrum you will find the broad skirts again, indicating lots of energy at frequencies other than the one we set.
TIP: Be careful when trying to set an integer number of cycles at high (relative) frequencies. The goal is not to make the last point on the trace line up with the first point, but to make the last point match the one just before the first point. As you get more cycles on the trace, the signal moves farther between samples, so the sample just before the zero-cross may be well below (or above) zero. When in doubt, trust the Spectrum to show this... when you get the lowest skirts, you are closest to the integer alignment.
The Spectrum shows us something besides an increase in bogus "skirt" signal when we don't have an integer number of cycles: We have also lost some of the true signal energy from the peak. How can we get an accurate reading of our signal? The obvious and best way, in experiments where the signal is a response to a stimulus created by the Generator, is to adjust the frequency to get integer alignment by using the Lines option. But that may mot be possible with an arbitrary external signal, or even a generated but changing signal.
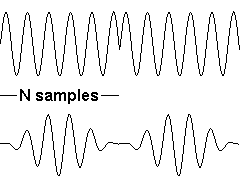
The problem comes from the glitch where the end of the trace should wrap back to the start. Hmmm... what if we could somehow taper both ends of the set of samples down to zero, so they always lined up perfectly if we looped them? What would that do to the spectrum?
Consider what would happen if the signal was amplitude modulated (AM) with a sinusoid whose period exactly matched our 1024-point sampling interval. The signal would smoothly go from zero to full-strength and back to zero, once per modulator cycle.
Those already familiar with AM may recall that the spectrum has two sidebands, one above and one below the carrier frequency, separated from it by the modulating frequency. This tells us what to expect from our tapered-samples spectrum:
In our case, the modulating frequency is one cycle per N points, which is the line spacing of the FFT output. In the case where the input signal is an exact integer number of samples, the unmodified spectrum would show a single line at that frequency. With AM windowing of the waveform before taking the FFT, the spectrum would show the "carrier" line flanked by two half-amplitude "sideband" lines. Our ability to resolve the true frequency is thus reduced, but if we can get rid of the large leakage skirts, this might be a bargain.
Let's use the Daqarta Generator to see what happens: Set Trigger active and set the trigger mode to Gen Sync. Make sure you are in waveform display mode (Spectrum and Sgram/PT off) and that X-axis eXpand is off.
On the Left channel of Stream 0, set Wave to Sine and Level to 100%. Open the AM modulator and toggle it on, along with AM Sync. Set the frequency step to Lines. Set the Main Freq to around 2000 Hz... the Lines option will set the exact value according to sample rate, such as 1937.98828 Hz for a sample rate of 44100 Hz. Set AM Depth to 100% and AM Phase to 270 degrees.
If the sample rate is 44100 Hz then one cycle per 1024 samples is 44100 / 1024 = 43.0664 Hz, so set AM Mod Freq to that value. (For 48000 Hz sample rate, set 46.875 Hz.) The waveform should now show one cycle of the AM modulation, smoothly going from null at both ends to maximum in the center.
Now look at the Spectrum (ALT+S) in Y-log mode (ALT+Y), and toggle AM off and on: The peak is slightly fatter with AM on, due to the two sidebands flanking it, and it is 6 dB lower. (That 6 dB is a simple factor of 2 that can be accounted for in calculating the windowed spectrum.)
The important thing is what happens when we now scroll Main Freq to other values that don't have an integer number of cycles per N samples. Set the frequency step back to Direct to allow this.
You'll see that the leakage skirts are much lower with AM active. There is also less variation in the peak height as the frequency changes: Only about 1.5 dB with AM, compared to nearly 4 dB without.
The formal name for this process is "windowing", and the "window function" is the shape that we multiply the data by. In our AM case this is a sinusoid, and with this AM Phase setting it is really a cosine wave raised up so the negative peaks are at zero.
This raised cosine is called a Hann or Hanning window, but there are many more shapes in use. Most are based on variants of this, usually with an additional cosine component at twice the main window cosine frequency. None of these other windows is clearly superior; each has advantages for particular tasks, although this simple Hann window is a good general-purpose choice. See Spectrum Window Function Select for a description of the window types available in Daqarta.
See also Spectrum Window Toggle, Spectrum Control Dialog
- Back to Sound Card Spectrum Window Toggle
- Ahead to Spectrum Window Bandwidth Correction (BW Corr)
- Daqarta Help Contents
- Daqarta Help Index
- Daqarta Downloads
- Daqarta Home Page
- Purchase Daqarta
Questions? Comments? Contact us!
We respond to ALL inquiries, typically within 24 hrs.INTERSTELLAR RESEARCH:
Over 35 Years of Innovative Instrumentation
© Copyright 2007 - 2023 by Interstellar Research
All rights reserved