Software for Windows
Science with your Sound Card!


Features:
Oscilloscope
Spectrum Analyzer
8-Channel
Signal Generator
Spectrogram
Pitch Tracker
Pitch-to-MIDI
DaqMusiq Generator
(Free Music... Forever!)
Engine Simulator
LCR Meter
Remote Operation
DC Measurements
True RMS Voltmeter
Sound Level Meter
Frequency Counter
Period
Event
Spectral Event
Temperature
Pressure
MHz Frequencies
Data Logger
Waveform Averager
Histogram
Post-Stimulus Time
Histogram (PSTH)
THD Meter
IMD Meter
Precision Phase Meter
Pulse Meter
Macro System
Multi-Trace Arrays
Trigger Controls
Auto-Calibration
Spectral Peak Track
Spectrum Limit Testing
Direct-to-Disk Recording
Accessibility
Data Logger
Waveform Averager
Histogram
Post-Stimulus Time
Histogram (PSTH)
THD Meter
IMD Meter
Precision Phase Meter
Pulse Meter
Macro System
Multi-Trace Arrays
Trigger Controls
Auto-Calibration
Spectral Peak Track
Spectrum Limit Testing
Direct-to-Disk Recording
Accessibility
Applications:
Frequency response
Distortion measurement
Speech and music
Microphone calibration
Loudspeaker test
Auditory phenomena
Musical instrument tuning
Animal sound
Evoked potentials
Rotating machinery
Automotive
Product test
Contact us about
your application!
Sound Card Precision Phase Meter/Plotter/Logger Mini-App
![[Phase Meter (44K image)]](Phase_Mtr.png)
- Introduction
- Initial Set-Up
- Reference Frequency
- Averager - For Noisy Signals
- Phase Plotter
- Plot to File
- Data Logging
- Phase Meter Accuracy
- Phase_Meter Macro Listing
- _Phase_Mtr_Ctrls Macro Listing
- _Phase_Mtr_Task Macro Listing
- _Phase_Mtr_Update Macro Listing
Introduction:
The Phase_Meter macro mini-app included with Daqarta allows precision measurement of the phase difference between two equal-frequency sine waves. Typically, one of these is a reference signal (which can be supplied by the Phase_Meter or from an external source), and the other is the phase-shifted output of a system that is driven by the reference.
The Phase_Meter can also display the phase as a scrolling plot, and optionally plot it to a .DQA file for later analysis in Daqarta, or save it to a time-stamped log file.
You can run Phase_Meter by hitting the F8 key followed by the 'P' key, or hitting CTRL+F8 to open the Macro Dialog and double-clicking on Phase_Meter in the Macro List.
Phase_Meter uses a Custom Controls dialog that allows adjustment of various parameters. You can open this Help topic by right-clicking anywhere in the dialog.
Phase_Meter loads PhaseMeter.GEN to produce same-frequency reference signals on the Left and Right outputs, opens the _Phase_Mtr_Ctrls macro to provide the Custom Controls dialog for adjustment of test parameters, and installs the _Phase_Mtr_Task macro to handle real-time display computations. The latter calls the _Phase_Mtr_Update macro to scroll the display plot, send plot data to the .DQA file, or update the log file.
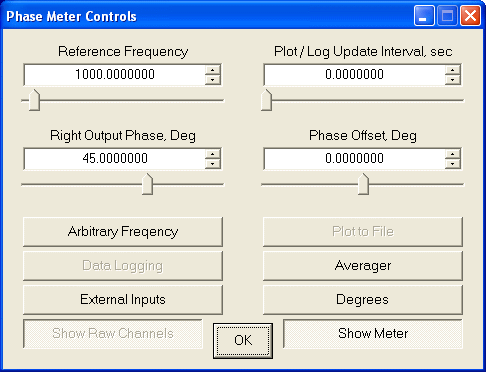
The Reference Frequency control adjusts both Generator frequencies. Left Out is typically used as the actual reference, but you can use your own external reference instead if required. (You would, however, then be unable to use the Spectral Line Lock option... see below.)
For test purposes, Right Out can supply a known phase difference from Left Out via the Right Output Phase control.
The Plot / Log Update Interval control sets the scroll rate for the phase plotting function, as well as the update rate for the Data Logging option when that button is active. When the interval is set to 0, no plot is shown and Plot to File , Data Logging, and Show Raw Channels are disabled.
The Phase Offset control allows manual correction for any fixed phase shift in the system, which may be due to differences between the Left In and Right In input circuits, or due to any part of the external circuit under test, such as a preamp for the response signal.
Arbitrary Frequency mode is used with an external reference frequency, or with the internal Left Out reference when you must use a specified frequency. Toggling this button to Spectral Line Lock causes the internal reference to snap to the nearest exact spectral line for best phase accuracy (typically 4 decimal places).
The Plot to File button (only enabled for non-zero Update Interval) toggles saving to a .DQA file whose base name (without .DQA extension) has been entered into Field1, or else prompts for the name if Field1 is empty.
The Data Logging button (only enabled for non-zero Update Interval) allows the current phase meter reading to be sent to a plain ASCII text log file, along with the current time, on every update. As for Plot to File, it requires a base name in Field1 and will append .TXT to create the log file.
The Averager button is provided to allow jitter reduction with noisy signals.
The External Input button can be toggled to Internal Test to bypass the sound card. This is useful for determining the intrinsic accuracy of the meter, such as by using the Generator to create controlled waveform distortion or interfering signals.
An additional click on Internal Test goes to Internal Test + Phase Mod, identical except that it activates Phase Modulation to vary the reference. This is especially useful for self-test. By default the phase will change in a smooth 0.1 Hz sine wave that moves +/-90 degrees relative to the current Right Output Phase setting. CTRL-click the button in this mode to open the modulation controls. (Much more on this under Phase Plotter Self-Test later.)
One more click goes to External Input + Phase Mod, which provides the same phase modulation as above for use with an external source. (This unusual button sequence allows you to jump to the phase modulation mode from the initial External Input using SHIFT+click, and a simple click to get back.)
The Degrees button can be toggled to Radians, which affects the plot Y axis scaling (including Plot to File), the meter display, and logged data values.
The Show Raw Channels button is active by default, showing the raw Left and Right input waveform data from which the phase is measured. This allows for visual adjustment or monitoring of signal levels. You can toggle this display off when plotting phase to reduce visual clutter, and/or to allow faster plotting on slow systems.
Finally, the Show Meter button allows you to hide the meter display for uncluttered viewing of the plotted phase response. On slow systems, it can also allow faster plotting due to reduced graphics overhead. This is particularly noticeable with large meter fonts. You will still be able to read phase values from Field3 under the Deg (or Rad) label below the Notes area.
Initial Set-Up:
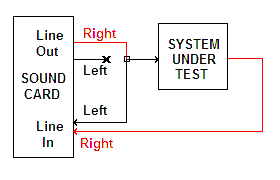
Typically, you would use Left Out from the Daqarta Generator as the reference source to drive the external system under test, and measure its response on Right Line In. In this case, you must also feed Left Out to Left Line In to serve as the reference input:

Alternatively, you can use the Phase_Meter with an external sine wave reference connected to Left Line In, and the response connected to Right Line In:

Usually, to make connections to the sound card, it will be easiest (and least expensive) to cut a male-male stereo cable in two and strip the internal conductors. (Left is white, Right is red, bare metal shield is ground) For initial set-up tests, you can make connections by twisting the stripped wires. The system under test may have specific connector requirements, or you may be able to connect to it with clip-leads. Don't forget to connect the shields to each other for the Left Out to Left In cable, and/or to the grounds of the external reference and system under test.
Whether you use the internal or external reference, you must make sure that Line is selected in the Input control dialog. Don't use Mic, unless that is all you have and it supports stereo... most Mic inputs don't. If your card has Input Level controls, set them to 0 (maximum sensitivity) for now.
Start Phase_Meter and adjust for strong but undistorted signals on the Left (yellow) and Right (red) Input waveforms. If you are using the internal reference, use the F9 function key to open the Generator volume sliders, and adjust the reference output while watching the input waveforms.
With an external reference, adjust its level to eliminate any obvious distortion on peaks.
Note that sound cards differ in their input capabilities, and that some cards reach overload at only about half of full scale. Ideally, you want the maximum undistorted input levels. One way to do this is raise the levels until the input waveforms are obviously clipped, then back off until the sine peaks no longer reach that level. You can also do this by toggling to Spectrum display mode and watching the input spectrum for the appearance of harmonics, then back off until those are mostly gone.
A small amount of distortion will not affect the phase measurements. Typically, even an inexpensive card or built-in chipset will show only a couple of harmonic peaks, and they will be about -80 dB lower than the main peak. As you raise the level, suddenly a forest of harmonics will jump up to -70, -60, or above. Back off to just below that jump point.
If your card has Input Level controls, you may be able to reduce the sensitivity (to more-negative values) and increase the Generator Master and/or Wave volume sliders while keeping low distortion. That provides a stronger driving signal to the system under test, if needed, and will give a better signal-to-noise ratio.
If the system under test causes a lot of signal attenuation, you may need to reduce the Left In (reference) sensitivity more than Right In (response signal).
Once you have the levels adjusted, click the Save Setup button in the Generator control dialog to save the PhaseMeter.GEN setup. The next time you run the Phase Meter it will use the saved Generator levels.
If you are using the internal Generator reference, set the Reference Frequency control to the desired frequency... see that subtopic below for more details.
Self-Test Options:
For initial testing purposes, just to learn your way around the Phase Meter, you can use a simple "loopback" consisting of a standard male-male audio cable. This will connect Left Out to Left In, and Right Out to Right In. In this case, the Right Output Phase control sets the phase of a signal that otherwise matches the Reference Frequency, to emulate the response from a real test system.
The default Right Output Phase is 45 degrees, but you will probably see something slightly different on the meter. The reason is that the sound card outputs and inputs are AC coupled through large capacitors, especially speaker/headphone outputs if there is no separate Line Out connector. Small mismatches in these capacitors and/or associated resistors can cause phase differences. (+/-0.05 degree is typical.)
These apparent errors are not indicative of those in an actual measurement situation, since there only the input differences contribute, which are typically smaller (+/-0.01 degree). In any case, the base error can be adjusted out for any particular Reference frequency via the Phase Offset control.
Beside the base error, you will also see jitter in the lowest decimal places. This is due to noise in the sound card output and input stages, which can be reduced by the Averager option (see below).
Without a loopback cable you can still try out the features of the Phase Meter, by toggling the External Inputs button at the lower left to Internal Test. This is like a "digital loopback", where the Phase Meter ignores the Input signals, if any, and looks directly at the digital streams from the Generator. The Right Output Phase control works just as above. With the default settings the meter will show something like 45.0003 degrees and no jitter. At Reference frequencies above about 1500 Hz you will typically see 45.0000 degrees.
Note that to observe the effects of Right Output Phase in shifting the waveform relative to the Reference, you should look only at Right In compared to Left In. (Don't compare Right In to Left Out, which is off by default.)
This is not only due to possible phase shifts in the sound card's input and output circuitry, but more importantly due to the fact that neither Windows nor the sound card itself provide any mechanism for intrinsic alignment between input and output waveforms. Sound cards have simultaneous sampling on the Left and Right inputs, and likewise on the Left and Right outputs, but not between inputs and outputs.
Daqarta can provide this alignment only after you have run an Auto-Calibration, specifically the Duplex Delay portion of the calibration. But even if you have done that, it's much better to rely on the simultaneous Left-Right input (or output) sampling.
Reference Frequency:
The Reference Frequency control is only used when the Daqarta Generator is providing the reference on Left Out. This is the preferred mode of operation, although you can alternatively use an external reference. However, the Left Out reference has the advantage of allowing the Spectral Line Lock mode for enhanced phase resolution.
- Phase Computations
- Arbitrary Frequency Mode
- Spectral Line Lock Mode
- Low Frequency Operation
- Phase Offset Control
- Custom Reference
Phase Computations:
The same basic math is used for both Arbitrary Frequency and Spectral Line Lock modes. An FFT spectrum is computed by the _Phase_Mtr_Task macro (even during waveform display) for the reference channel (Left In), and one for the signal input (Right In). The reference peak position is determined by scanning the magnitude spectrum, and the phase at that frequency is computed from the real and imaginary components of the raw spectrum. The same position is used with the signal spectrum, and its phase is likewise found. The phase of the signal relative to the reference is then found by simple subtraction.
Note that the difference operation is critical. The individual phase measurements are relative only to the start of the data set used to obtain the spectrum; there is no absolute significance to the value obtained. You might think that the Trigger option could start each data set at the same point on the reference waveform, but such is not the case.
This is due to the fact that (except in Spectrum Line Lock mode) the waveform frequency is not synchronous with the sampling operation. The waveform may cross the trigger threshold at any time during the sample interval, but the FFT is computed only with the actual sampled data. So one frame may find the waveform crossing the trigger just after a sample instant, and another frame may find it crossing just before the next sample instant.
Fortunately, sound cards sample both input channels simultaneously, so no matter where in its cycle the reference waveform starts, the signal waveform will track it and remain at the same relative phase. In fact, no triggering is needed; the waveforms can roll freely and the measured phase will not be affected. (Triggering is needed for noise reduction using the Averager option, however.)
Arbitrary Frequency Mode:
The FFT phase difference technique is "perfect" for pure sinusoids that have an exact integer number of cycles in each 1024-sample array. That doesn't usually happen in the real world, so there may be fractional cycles at either end of the array. In such cases the spectral peak will "leak" to adjacent frequency bins of the FFT.
To reduce this spectral leakage and concentrate the energy into a better-defined peak, a Hann window is applied to the raw waveform data in the process of computing the FFT. (See Spectrum Window Theory and Demonstration for an illustration.)
Although the Hann window is set by default at the start of the Phase_Meter macro, you can toggle it off via the Window button in the Spectrum control dialog, or via the ALT+W hot-key shortcut if Spectrum mode is active. From the dialog, you can also experiment with other window functions besides Hann.
To see how effective the window function is, run Phase_Meter and toggle its External Inputs button to Internal Test. This uses the Generator output directly, bypassing the sound card entirely to avoid possible issues with phase shift due to the card's input and output AC-coupling capacitors. The "signal" phase is entirely determined by the Right Output Phase control on the Phase_Meter dialog, relative to the Left Output reference. (Plus any Phase Modulation, if active... see Phase Plotter Self-Test , below.
With the default 1000 Hz Reference Frequency and 45 degrees Right Output Phase, the meter should read something like 45.0003 degrees. Toggle Window off and you will see it jump by more than 0.300 degrees above or below the windowed mode. At other Reference Frequency or Right Output Phase settings you may see even greater differences.
Spectral Line Lock Mode:
This mode gives results accurate to about 0.0001 degree with low-noise sinusoids. It eliminates the need for the above window function by constraining Generator frequencies to steps of (Sample Rate / 1024), equal to the spectral line spacing... 46.875 Hz at the default 48000 Hz sample rate.
If you repeat the above Internal Test experiment, you will see 45.0000 degrees (or whatever Right Output Phase you set) at all frequencies, regardless of whether the Spectrum Window button is active.
However, for real-world use, Spectral Line Lock only works if the Generator output is driving your experiment, and your protocol allows you to use one of the Line Lock frequencies. If you must comply with test specifications that require a certain frequency like 1000 Hz, you have to use Arbitrary Frequency mode.
Low Frequency Operation:
With the default sound card sample rate of 48000 Hz, the Phase Meter gives best results for reference frequencies of roughly 1000 Hz and above.
At lower frequencies (unless Spectral Line Lock is active, which always gives "perfect" results) the error rises because a fractional cycle in the FFT array can have a larger percent of the total energy, even after spectral windowing. Consider that at about 70 Hz when there are 1.5 waveform cycles in the 1024-sample array, that extra half-cycle has one-third of the total energy. Worse, since it takes up 1/3 of the waveform, simply attenuating the ends with a center-weighted window function doesn't help much.
By comparison, when there are 21.5 waveform cycles (at about 1000 Hz) then the half-cycle is less than 2.5% of the total energy, and it falls at the tail of the window where it is heavily attenuated.
For frequencies below about 70 Hz the error can be nearly 2.5 degrees with the default Hann window, but drops down to about 0.50 degrees with Hamming. For all other frequency ranges Hann is best.
However, there are two other approaches that give superior results. Both work on the same idea: If you reduce the sample rate, there will be more waveform cycles within the 1024-sample array. This will mean any fractional cycle will be a smaller percentage of the total, and will be more into the tails of the window function.
Another way to think about this is that the spectral line frequency spacing is 1/1024 of the sample rate, so as the sample rate becomes smaller these "sweet spot" frequencies are closer together and thus closer to any arbitrary frequency.
The two ways of controlling sample rate are both in the X-Axis control dialog. The simplest is to simply reduce the Sample Rate directly, by entering (say) 4800 instead of the default 48000.
Alternatively, you can leave the default 48000 there and set Decimate on, with a factor of 10X to get 4800 Hz equivalent sample rate.
As an example of the amount of improvement, a 60 Hz reference was used in Internal Test mode. With the default 45 degree Right Output phase, the meter showed 46.83xx degrees when using the default 48000 Hz sample rate, but 45.0009 degrees with either 4800 Hz, or with an effective 4800 Hz via 10X Decimate using the original 48000 Hz.
The direct rate change is usually fine for phase measurement, although some systems have problems with these low rates due to the way the sound card and/or Windows implements them. (The input and output sample rates may end up slightly different, but since the Phase Meter is really only using the inputs for measurement, this is not a problem.)
Also, since this method reduces the output sample rate, the reference waveform will be somewhat coarser... again, not likely to be a problem for Phase Meter measurements, unless the system under test is extremely temperamental.
The Decimate alternative preserves the original output rate and waveform, and computationally reduces the input rate by an exact ratio. The main drawback of this is that there is no "overlap" when Trigger is active. (Trigger is required for Averager operation).
Consider that with a 4800 Hz effective sample rate it takes 1024 / 4800 = 0.213 seconds of data to fill the waveform array used for the FFT. Yet with no Trigger, even an old 1.6 GHz XP laptop with integrated graphics can update the display in only 0.015 sec (or less). Each update uses the most recent 1024 samples, which means it is re-using 0.198 sec of prior data... an overlap of 0.198 / 0.213 = 93%.
When Trigger is active, there can be an additional delay of up to one waveform cycle while waiting for the trigger point. A 50 Hz reference frequency, for example, could add up to 0.020 sec, giving 0.035 sec between updates. But that's only with a direct 4800 Hz sample rate... with 48000 Hz and a 10X Decimate factor, the trigger system does not support overlap; it takes at least 0.213 sec and possibly 0.233 sec per update.
This is not typically a problem for Meter display, but it does limit the plotting and data logging rates. Update Intervals less than 0.500 sec would not be accurate (although the time stamp on logged data would show the actual times).
Phase Offset Control:
Once you have set the desired Reference frequency, you can set the Phase Offset control. This is essentially a "zero adjust" control, which compensates for any fixed phase shifts in the system.
Typically, there will be small differences between the Left In and Right In phase shifts, which change with frequency. As an example, the built-in audio of an old XP laptop has a phase difference of 0.0160 degrees at 1000 Hz, falling linearly to 0.0004 degrees at 20000 Hz.
To compensate for this, temporarily connect the reference (typically Left Out) directly to Right In, in place of the phase signal to be measured. Leave the existing reference connection to Left In, so you will have the same signal going to both input channels.
The Phase Meter should ideally read zero, but probably won't. You need to enter that same value into Phase Offset, but first you should activate the Averager button to reduce any jitter. (See that topic, below.) For ultimate precision you can set an especially high Frames Request just for this purpose, and wait for the Total Frames Counter (just under the Averager button on the main Daqarta toolbar) to show 'TC'. That means the jitter is averaged out as much as that Frames Request can provide.
Now left-click the meter reading. You will see a "Copy to Clipboard?" message that shows the meter reading. Click "Yes" or hit ENTER. Then highlight the current value in the Phase Offset control, and hit CTRL+V to paste the value from the clipboard. The meter should now read zero. If it's still a bit off, manually change the Phase Offset value in the same direction by adding the meter value to the original setting.
You can also use Phase Offset to compensate for any fixed phase shifts in the system under test. For example, if you are testing a capacitive pressure sensor in a setup that includes other phase shifts due to wiring or signal preamps, you can perform the above adjustment with the actual working system. First set Phase Offset to zero, then apply zero pressure to the sensor (via venting to atmosphere, perhaps). Then copy an averaged Phase Meter reading to the clipboard and paste it into Phase Offset as above. That will compensate for phase shifts in all parts of the system, including any differences between Line In channels.
Custom Reference:
If you want to see how your system under test responds to a reference with changing phase, you can produce a wide range of signals from the internal reference. To do this you must rewire the Phase Meter to swap the output signals. The standard wiring for use with an internal reference looks like this, which uses Left Out as the reference to drive the external system:
To swap outputs, change it to this:
Now Right Out is the reference, and Left Out is ignored. While setting up the special reference, it will be helpful to bypass the system under test (so you can monitor the reference itself) and activate the Phase Plotter by setting the Update Interval to a non-zero value. (0.10 seconds is a good choice.) A horizontal orange line will appear at 0 on the Y axis, which will now show degrees.
Next, increment External Source through Internal Test to Internal Test + Phase Mod. This will activate phase modulation on the Right output channel to get a smoothly-changing plot.
Phase Modulation Setup:
By default the phase plot will describe a smooth 0.1 Hz sine wave that moves +/-90 degrees relative to the current Right Output Phase setting. (You can toggle off Show Raw Channels or the raw waveform display buttons for this, if the waveforms sliding past one another are too distracting.)
A floating CTRL+Click button for Phase Modulation controls message box will appear when in Internal Test + Phase Mod mode. Doing that will open the Generator dialog plus the Left Wave Controls dialog for Stream 3 (L.3 Stream).
The Tone Freq control sets the frequency of the modulating sine wave, which is the frequency of undulations on the phase plot.
The Level control controls the phase excursion. The default of 50% gives +/-90 degrees. 100% would in principle give +/-180 degrees, but in fact you should set 99.9% or less to avoid huge spikes where positive peaks "wrap" to negative values (or negative peaks wrap to positive) due to internal overflow. And that's with Right Output Phase set to 0. Otherwise, whenever the combination of Right Output Phase plus the modulation peaks hit +/-180 you'll get overflow.
But you are not limited to simple sine waves. Click the Wave button to open the Wave Type dialog; you can choose from Sine, Triangle, Ramp (or Staircase), Square, or Pulse wave shapes. You can use custom Arb waveforms, or Play complete long-duration programs. You can use White, Gauss, or Pink noise, or set your own noise Band limits or shape.
You can get much more complex behavior by using Stream Modulation dialog options to "modulate the modulation":
Burst allows the phase modulation to come in bursts of any length, with arbitrary rise and fall times.
AM lets you smoothly vary the amount of phase modulation in adjustable amounts and cycle times.
FM allows the phase modulation frequency to vary.
PM normally produces Phase Modulation, which for simple waveforms is much like FM. But it can be used for Pulse Width Modulation (PWM) of the Pulse wave shape, which keeps the overall modulation frequency (Tone Frequency) the same but varies the width of the pulses within each cycle.
Sweep smoothly changes the modulation frequency between lower and upper limits over the interval you set, then repeats.
For additive combinations like a noisy phase waveform (not the same as a noisy reference or signal waveform), you can set the basic wave as above, then add noise (or any other waveform) using the separate Stream L.2. That stream is set by default to add to the L.3 Stream, but not active. Click the [2] button at the top to move to the L.2 Stream, then click Stream Mod to toggle it on. Now you have all the above options available for this stream as well.
Note that the Level settings of the two streams add together. If you see spikes on the peaks of the plot, try reducing Levels.
Averager - For Noisy Signals:
With the self-test loopback, or with a real system under test, you will typically see jitter in the least-significant digits of the meter. This is due to noise in the sound card electronics, plus any external system noise. You can reduce this jitter by toggling the Averager button on in the Phase Meter dialog (not the button on the main Daqarta toolbar). With the default Frames Request of 32 in the Waveform Averager dialog, you can usually expect one additional jitter-free decimal place in the meter reading.
Higher Frames Request values will further reduce the jitter, at the cost of making the meter less responsive to rapid changes in the actual signal phase. You usually have to double the number of frames to get a noticeable improvement, and probably quadruple or more to get another jitter-free digit.
Note that waveform averaging provides true noise reduction on measured signals, not just "smoothing" of the measured value. To see the raw signal, toggle Averager off and then toggle off all the display channels (at the lower left of the waveform display) except for the red Right In button. With a noisy signal, you'll see the waveform bouncing around. Now toggle the Averager on to see the noise reduction. You can repeat this in Spectrum mode to see the noise floor drop by 15 dB with 32 frames averaged. (You get 3 dB of reduction for each doubling, so 2 frames gives 3 dB, 4 gives 6 dB, 8 gives 9 dB, 16 gives 12 dB, and 32 gives 15 dB.)
Note: In waveform display mode, the Averager button in the Phase Meter dialog is equivalent to the one on the Daqarta toolbar, with the exception that it always insures that Trigger is active.
However, if Spectrum mode is active and you use the toolbar button, it will start a spectrum average instead of a waveform average. Instead of reducing noise, a spectrum average shows the average noise... it doesn't reduce the noise floor, just smooths it. Using the Phase Meter Averager button will insure a waveform average even in Spectrum display mode.
You can experiment with noise reduction using the loopback or Internal Test methods described in the above Self-Test Options section. The PhaseMeter.GEN Generator setup that is automatically loaded by the Phase_Meter macro makes this easy.
While the Phase Meter is running, click the Right Wave Controls button in the Generator dialog. At the top of the R.0 Stream dialog that opens, click the [1] button to change to R.1 Stream. Clicking the Stream On button will add a noise floor that is about 65 dB below the peak of the simulated signal on the Right channel. This is a White noise whose Level is set to 1% of maximum, added into the R.0 Stream Sine whose Level is at 80%. This is barely visible on the waveform as a tiny jiggling, but is conspicuous in Spectrum mode. Activate the Averager button to see the spectrum noise floor drop away.
You can set the R.1 Stream Level to higher values, but don't exceed 20% unless you also reduce the R.0 Level so that the total is no greater than 100%.
Phase Plotter:
The Phase Meter can plot the current phase on the screen, as well as (or instead of) displaying it on a meter.
To start the plotting, set the Update Interval to a non-zero value. This control allows 19 discrete rates from one sample every 0.010 sec (100 samples per second) to 1 sample per hour. You can easily replace any of these with custom rates, including super-slow rates of one sample per day or slower.
Plotting must be active to use the Data Logging or Plot to File options... see those topics below.
The phase plot is an orange line that will scroll across the screen from right to left, with its vertical position indicating the current Phase Meter reading over +/-180 degrees... full-scale on the vertical axis.
The X axis and trace grid will change to show plot time. For example, if you set the Update Interval to 0.10 sec, the X axis will run from 0 to 1023 plot samples, or 102.3 seconds. The signal waveform display won't change... it will still be using the same timing as before, but the X axis will no longer apply to it.
Note that plots are only visible in waveform display mode, not Spectrum mode. Also, both input channels are enabled for display by default. To avoid distractions by the raw waveforms, you can toggle the Show Raw Channels button off. Alternatively, you can toggle individual channels off or on via the display enable buttons just below the lower left of the display area.
CAUTION: If you had set the X-Axis eXpand to spread out the waveform display for better time resolution, you may want to toggle it off before starting the plotter. The reason is that the eXpand Max and Min limits will change to plotter time, with the same proportions as the former waveform time. For example, if you had set Max to 10.65 msec (half of the normal 21.3 msec full display width), then when the plot is active Max will be half of the plot time. Using the prior example of Update Interval set to 0.10 second, Max will now be be half of 102.3 seconds or 51.15 seconds. That's how long it will take before any changes in the phase plot will scroll onto the screen from the right. So if eXpand is on you may think that the phase plot isn't working, when it's really just working its way to the screen.
Unlike the similar Chart Recorder mini-app, there is no Phase Meter control to toggle between Interval and Time plotting modes; phase plotting defaults to Interval, but you can change to Time by editing the U1=0 line in the Phase_Meter macro to U1=1.
In Interval Mode, the first time point is plotted immediately after you set the Update Interval, and thereafter at the Update Interval rate. So if you set Update Interval to 1 second and the current time is 12:34:56.78, the first point will be shown then, and the next point will be at 12:34:57.78, etc.
In Time mode, the first point is not plotted until the UTC Time is a multiple of the Update Interval, and thereafter at that rate. If you set the Update Interval to 1 second at 12:34:56.78, the first point will be at 12:34:57.00, the next at 12:34:58.00, etc... always exactly on the second.
Time mode may be required for "every minute on the minute" (or whatever) test specifications. It also makes a log file (see below) easier to read, and easier to compare with similar log files. However, if you are starting a test that uses a lengthy interval, it may look like nothing is happening until the time hits the next exact integer multiple.
The phase plotter allows "vertical zoom" to magnify any portion of the plot for closer visual examination. Display magnification is accomplished by the same PgUp and PgDn keys as normal waveform displays. But if the phase plot happens to be too far above or below the zero centerline, the magnified plot may go off-screen.
However, as with normal waveforms, you can change Screen Zero to force the part of the phase plot beneath the solid cursor to go to the centerline, where it does not shift during magnification. Click on the Zero button in the main Daqarta toolbar to enable this mode, then position the solid cursor as desired and hit the 'z' key to shift that part of the plot to zero, and magnify as needed with PgUp.
You can hit the 'z' key as often as you like to examine various portions, or as the plot changes. Toggle Zero off to return to the unshifted display.
X-Axis Auto-Calibration For Time:
The selected Update Interval indicates the effective time between plotted phase "samples", which is the reciprocal of the effective sample rate. The _Phase_Mtr_Ctrls macro sets this via the Buf0#R=1/K command, where K is the effective update interval.
However, at the faster settings (0.01 and 0.02 seconds/update) some older systems with slow graphics processors may have trouble keeping up. For this reason, the Phase Meter continually checks the true update interval at these fast speeds and sets a new Buf0#R value every 10 samples. The value is smoothed using a time constant of 100, to reduce axis jitter due to small random timing differences.
The current smoothed value is shown in Field2 under the 'sec' label, below the main Notes area.
This is all done at the end of the _Phase_Mtr_Update macro. The UN variable is used as a counter, and each time it exceeds 10, the time L for the last UN samples is found via L=(Time-N)<<32/10M / UN. (The <<32/10M scales the Time value from 100s of nanoseconds to seconds.) The current effective update interval K is found using this new L value and time constant 100 via K=K+(L-K) / 100. (See the Meter Time Constants subtopic under Custom Meter Macros for a discussion of this method.)
Note that the above computations are only performed when IF.UR=<3 is true, where the UR update interval index is 1 (0.01 sec) or 2 (0.02 sec). (Note also that the =< notation here means "is less than", not "less than or equal to".) The 0 case is never encountered, since then _Phase_Mtr_Update is not called.)
This assumes that larger intervals will be OK... true for most systems, under most conditions. But if your system is particularly slow, or you are using a particularly large meter to show the phase, even some larger intervals may need auto-calibration. You can change the IF statement to use a higher limit than 3, as desired.
To improve plotting performance on a slow system, consider toggling off Show Raw Channels and Show Meter. Note that the meter values are also shown in Field3, so you won't be giving up any information, just the larger display size of the meter. Or you might compromise by leaving the meter on and resizing it smaller by dragging a lower corner.
Phase Plotter Self-Test:
If you want to experiment with the Phase Plotter option without having a complete test setup and a changing phase signal, you can use the loopback or Internal Test options discussed previously under Self-Test Options.
In either case, you can use the Right Output Phase control to move the plot line up and down the screen. But you can also increment External Inputs through Internal Test to Internal Test + Phase Mod. This will activate phase modulation on the Right output channel to get a smoothly-changing plot.
Now follow the Phase Modulation Setup instructions under Custom Reference . You can create a large variety of phase plots, with various waveshapes and behaviours.
If instead you want to add noise or some other waveform to the signal (not the phase as above), follow the directions under the Averager topic.
Another experiment you can try is to first select Internal Test mode without Phase Mod. The phase plot should show a constant flat line at the Right Output Phase value.
Then open the Generator dialog and click Right Wave Controls. Tone Freq is the "signal" frequency, and will be set to the same Reference Frequency you set in Phase_Meter. Set it 0.10 Hz higher, and there will be an ever-increasing phase shift between them. The phase plot will show a straight-line ramp until it hits 180 degrees, then it will wrap to -180 and continue up again. The full ramp cycle takes 10 seconds (the reciprocal of the frequency difference). Setting Main Freq to 0.10 Hz lower than the Reference will reverse the ramp direction.
Frequency Synchrony / Drift Monitor:
The final Phase Plotter Self-Test experiment above suggests an easy way to monitor drift between two frequencies that are supposed to be synchronized: In External Inputs mode (without Phase Mod), the phase will ramp continuously if the frequencies are not identical. This is much more conspicuous than digital frequency display methods.
Use this setup to compare the System Under Test to the internal reference:
Or use the following to compare two external sources, even if the System Under Test is not being driven by the External Reference but is a free-running source you want to manually adjust for a match:
Plot to File:
This button is only enabled when Update Interval is non-zero to enable phase plotting. Plot to File requires that you first enter the desired file name in Field1 under 'File Name' label, below the main Notes area. Do not enter a file extension; .DQA will be added during the actual save operations.
If you attempt to toggle Plot to File when there is nothing in Field1, the button will not stay down. Instead, you will see a message box prompting for a name in Field1.
Once you have entered a name and toggled Plot to File on, "File Start:" is written to Notes, followed by the current time. Then file recording begins with the current 1024 points visible on the screen. This means that the first screen saved actually happened before you hit the button, giving you a safety factor to capture an event after you notice it.
Each additional 1024 points (one complete screen scroll) will be appended to the file as needed. When you toggle Plot to File off, "File End:" is written to Notes along with the current time, then any newly added points since the prior 1024 will be appended to the file.
Since the .DQA format automatically includes Notes, when you later open the file you can see the actual time you hit the Plot to File button. This may be helpful for finding that point in the file, especially using Time or UTC units with the file position readout. Note, however, that while it is labeled "File Start" it is really the button-hit time, and that it refers to the end of the first screen.
Note that files will always be saved with the Field1 name in the default Documents - Daqarta - User_Data folder... there is no standard Windows Save As dialog to allow selecting a name from a list, or specifying another folder.
You must not change the Field1 name during recording, since it is used repeatedly to specify which file the new data should be appended to.
Note that after each write or append operation the file is closed and stable; if (say) the power fails mid-recording, all previously-saved data remains securely written to the hard drive... the worst you could lose would be the points between the last 1024 saved and the time of the power failure.
You should always use Daqarta to read and analyze these files, even though the .DQA format used for Plot to File will be technically readable by any software that accepts .WAV files in compliance with the Microsoft RIFF standard. (You may, however, need to tell such software to look for .DQA extensions, since it won't show them by default. You can always rename the file to use a .WAV extension if all else fails.)
However, note that such non-Daqarta software will ignore any sections of the file that it doesn't understand. (That's the whole idea behind the RIFF standard used by .WAV and .DQA files.) Since the standard .WAV header doesn't support slow effective sample rates, vertical range calibration, or vertical units that are included in the .DQA section, .WAV-only software can only show the waveform as a general shape... you won't be able to read values in degrees, for example, or see the proper timing on the X axis.
Data Logging:
Toggling this button on while the Phase Plotter is running (non-zero Update Interval) will send the phase data to the current log file every time a point is plotted.
The log file defaults to DqaLog.TXT, but you can change it by adding a LogName command to the Phase_Meter macro.
Each file line consists of a time stamp followed by the phase reading, in the same units as the meter. They will be degrees unless the Degrees button is toggled to Radians.
Note that at the fastest speed(s) the timing (for both the plot and the log) may not be exact unless you have a fast system, due to system graphics overhead. As an example, at 0.010 sec (100 samples per second) an old 1.6 GHz laptop with integrated graphics actually takes 0.015 seconds; however, at 0.020 sec the timing is exact, as shown in the log file output.
You can change the log format by modifying the LogTxt line in the _Phase_Mtr_Update macro... see below.
Phase Meter Accuracy:
The Phase Meter is most accurate for pure sinusoidal waves. Noisy or distorted sinusoids will give poorer results. Noise was discussed under Averager - For Noisy Signals ; it basically adds jitter to the readings, which can be reduced by signal averaging.
Moderate distortion (a triangle instead of a sine wave) has no effect on the readings, but a ramp, square, or pulse wave is not acceptable. The problem with these is that they have sharp edges which cause strong upper harmonics. Due to aliasing, these harmonics "reflect" back down to the reference frequency and add errors.
However, you can add a simple low-pass filter made of a single resistor and capacitor to reduce the worst of the harmonics. The results won't be as good as with a sine or triangle, but they may be acceptable for non-critical work. You should be able to get errors in the 0.5 degree range or better. Note that filters introduce their own phase shifts. If you put "identical" filters on the Left In (reference) and Right In (signal) lines, the phase shifts will tend to cancel, and any residual can be eliminated with the Phase Offset control.
The Phase Meter is relatively immune to interference, as long as the interfering signal is not too close to the reference frequency; typically there is no effect as long as it is more than 500 Hz away, even if it is 10 times larger than the signal itself.
Differences between Left and Right sound card input circuits can add a frequency-dependent phase shift to measurements. This can be compensated for any particular reference frequency... see the Phase Offset Control section under Reference Frequency, above.
The underlying accuracy, independent of sound card input and output circuits, is seen when you toggle the External Inputs button to Internal Test. (See Self-Test Options under Initial Set-Up , above.) This is better than 0.0001 degree in Spectral Line Lock mode, at all Line Lock frequencies. (It's actually about 0.000001 degree, but only 4 decimal places are shown on the meter.)
In Arbitrary Frequency mode, accuracy is within 0.0005 degrees at frequencies of 1000 Hz or above.
With default settings, underlying accuracy is progressively worse down to 70 Hz, where it can be nearly 0.5 degree off. Below 70 Hz, you must change the spectrum window from the default Hann to Hanning just to maintain half-degree accuracy. However, you can maintain full 0.0005 degree accuracy by using a lower sample rate... see Low Frequency Operation , under Reference Frequency above.
Phase_Meter Macro Listing:
;<Help=H4905
Close=                 ;Close any open data file
Spect=0
Sgram=0
Trig=1
TrigMode=Norm
TrigSrc=LI
TrigLevel=0
TrigDelay=0
QU=UserUnits           ;Save units for restore on exit
A.LoadGEN="PhaseMeter"
R.0.PM=0               ;Phase Modulation Off (default)
Z=0
ZeroUnits=0
SpectWindOn=1
SpectWind=0            ;Hann Window
E.IF.WaveMute=         ;No mute on Vista or later
    WaveMute=0             ;Unmute XP
ENDIF.
E.IF.MasterMute=
    MasterMute=0
ENDIF.
InL=1
InR=1
Input=1
WavgMode=Exp
WavgFrames=32
Label1="File Name"
Label2="sec"
Field2=
LI.Disp=1          ;Show Left In and Right In channels
RI.Disp=1
LO.Disp=0
RO.Disp=0
CursChan=0         ;Solid cursor readout to Left In (chan 0)
CursDotChan=1      ;Dotted readout to Right In (chan 1)
Buf7[0]=0          ;0 = Plot/Log Off
Buf7[1]=0.01       ;sec per Plot/Log update
Buf7[2]=0.02
Buf7[3]=0.05
Buf7[4]=0.1
Buf7[5]=0.2
Buf7[6]=0.5
Buf7[7]=1
Buf7[8]=2
Buf7[9]=5
Buf7[10]=10
Buf7[11]=20
Buf7[12]=30
Buf7[13]=60
Buf7[14]=120
Buf7[15]=300
Buf7[16]=600
Buf7[17]=1200
Buf7[18]=3000
Buf7[19]=3600
Buf7[20]=7200       ;Dummy, for limit math

Ctrls="<<Phase Meter Controls"

Ctrl0="<<Reference Frequency"
Ctrl0="<S(SmplRate/1024,23000)"
F=1000
Ctrl0=F
L.0.ToneFreq=F
R.0.ToneFreq=F

Ctrl1="<<Plot / Log Update Interval, sec"
Ctrl1="<S(0,3600)"
Ctrl1="<s(0,19)"
UR=0               ;Plot/Log Off default
Ctrl1#s=UR
R=Buf7[UR]
Ctrl1=R
U1=0               ;Interval mode; set U1=1 for Timer mode

Ctrl2="<<Right Output Phase, Deg"
Ctrl2="<S(-180,+180)"
Ctrl2=45

Ctrl3="<<Phase Offset, Deg"
Ctrl3="<S(-180,+180)"
Ctrl3=0

Btn0="Arbitrary Freqency"
Btn0="<T"
Btn0=0
Fstep=Dir

Btn1="Plot to File"
Btn1="<T"
Btn1="<D"
Btn1=0

Btn2="Data Logging"
Btn2="<T"
Btn2="<D"
Btn2=0

Btn3="Averager"
Btn3="<T"
Btn3=0

Btn4="External Inputs"
Btn4="<M(3)"
Btn4=0

Btn5="Degrees"
Btn5="<T"
Btn5=0
V=180
UU="Deg"
Label3=UU(A)

Btn6="Show Raw Channels"
Btn6="<T"
Btn6="<D"
Btn6=1

Btn7="Show Meter"
Btn7="<T"
Btn7=1

Mtr0="<<Phase - Degrees"
Mtr0="<C(0)"
Mtr0="<B(hFFFFFF)"
Mtr0="<H4905"

Buf3="<=(0)"
Buf3#Z=128

Task="_Phase_Mtr_Task"
@_Phase_Mtr_Ctrls=Ctrls
Task="-_Phase_Mtr_Task"
Mtr0=
Buf3="<d-"
Buf0#Z=0
Msg=
UserUnits=QU       ;Restore saved units
LI.Disp=1
RI.Disp=1
LO.Disp=1
RO.Disp=1
Gen=0
Input=0
A.LogName="DqaLog"     ;Restore default Log file
_Phase_Mtr_Ctrls Macro Listing:
;<Help=H4905
IF.Ctrls=0         ;Ctrl0, Ref Freq
    S=SmplRate?X / 1024    ;Line step size = min freq
    IF.Btn0=1              ;Spectral Line Lock?
        IF.Ctrl0?u=!0      ;Up/Dn scroll?  Next/prior step if so
            L.0.ToneFreq=cint(L.0.ToneFreq / S + Ctrl0?u) * S
        ELSE.
            L.0.ToneFreq=cint(Ctrl0 / S) * S   ;Nearest step
        ENDIF.
    ELSE.                  ;Arbitrary Frequency
        L.0.ToneFreq=Ctrl0     ;Accept entry as-is
    ENDIF.
    F=L.0.ToneFreq         ;New freq
    IF.F=<S                    ;Below min freq?
        F=S                        ;Min = step if so
        L.0.ToneFreq=F
    ENDIF.
    Ctrl0=F                    ;Ctrl to new freq
    R.0.ToneFreq=F             ;Right to new freq
ENDIF.

IF.Ctrls=h80           ;Ctrl0, Ref Freq slider
    S=SmplRate?X / 1024    ;Line step size
    IF.Ctrl0=<S            ;Below min?
        Ctrl0=S                ;Set min = step
        L.0.ToneFreq=S
        R.0.ToneFreq=S
    ENDIF.
ENDIF.

IF.Ctrls=1             ;Ctrl1, plot speed
    IF.Ctrl1?u=!0          ;Up/Dn buttons
        UR=UR+Ctrl1?u          ;Next/prior step
        IF.UR=>19              ;Too big?
            UR=19
        ENDIF.
        IF.UR=<0               ;Too small?
            UR=0
        ENDIF.
    ELSE.                  ;Direct entry
        UR=0
        WHILE.UR=<=19          ;Test all speeds
            A=(Buf7[UR] + Buf7[UR+1]) / 2      ;Midway to next
            IF.Ctrl1=<A                ;Entry less than midway?
                LoopBreak=2            ;Stop here if so
             ENDIF.
             UR=UR+1                   ;Else test next speed
        WEND.
    ENDIF.
    R=Buf7[UR]             ;Interval for this step
    K=R                    ;For plot X-axis / timing check
    UK=0
    Ctrl1=R                ;Set control display
    Ctrl1#s=UR             ;Set slider position
    IF.UR=0                ;Plot off?
        Buf0#R=0               ;Restore default X axis
        Buf0#V=0               ;Restore default Y axis
        UserUnits=QU           ;Restore Y units
        Btn1="<D"              ;Disable Plot to FIle
        Btn2=0                 ;Data Logging off
        Btn2="<D"              ;Disable Data Logging
        Btn6=1                 ;Show Raw Channels
        Btn6="<D"              ;Disable button
        Buf3="<d-"             ;Remove data plot
        Buf3="<=(0)"
    ELSE.                  ;Else plot on
        Buf0#R=1/K             ;Set X axis ("sample rate")
        Buf0#V=V               ;Set vertical range
        Buf0#U=UU(A)           ;Set units (Deg/Rad)
        UserUnits=1
        Btn1="<N"              ;Enable Plot to File
        Btn2="<N"              ;Enable Data Logging
        Btn6="<N"              ;Enable Show Raw Channels
        Buf3="<dWU(255,128,0)" ;Set plot color
        IF.UR=<4               ;Fast speeds (0.05 sec or less)?
            UT=1                   ;Time mode if so
        ENDIF.
    ENDIF.
    Field2=""          ;Clear timing check field
ENDIF.

IF.Ctrls=h81           ;Ctrl1, plot speed slider
    UR=Ctrl1?s             ;Get slider posn
    R=Buf7[UR]             ;Interval for this posn
    Ctrl1=R                ;Set control display
    K=R                    ;For plot X-axis / timing check
    UK=0
    UT=0                   ;Assume Interval mode
    Field2=""              ;Clear timing check field
    IF.UR=!0               ;Trace on? (not 0 range)
        Buf0#R=1/K             ;Set X axis ("sample rate")
        Buf0#V=V               ;Set vertical range
        Buf0#U=UU(A)           ;Set units (Deg/Rad)
        UserUnits=1
        Btn1="<N"              ;Enable Plot to File
        Btn2="<N"              ;Enable Data Logging
        Btn6="<N"              ;Enable Show Raw Channels
        Buf3="<dWU(255,128,0)" ;Set plot color
        IF.UR=<4               ;Fast speeds (0.05 sec or less)?
            UT=1                   ;Time mode if so
        ENDIF.
    ELSE.                  ;Trace off if plot off
        Buf0#R=0               ;Restore default X axis
        Buf0#V=0               ;Restore default Y axis
        UserUnits=QU           ;Restore Y units
        Btn1="<D"              ;Disable Plot to FIle
        Btn2=0                 ;Data Logging off
        Btn2="<D"              ;Disable Data Logging
        Btn6=1                 ;Show Raw Channels
        Btn6="<D"              ;Disable button
        Buf3="<d-"             ;Remove data plot
        Buf3="<=(0)"
    ENDIF.
    UN=0                       ;For plot X-axis / timing check
    N=Time
    T=Time<<32/10M + R     ;(10M = 10^7)
    X=int(Time<<32/10M/R)
    @_Phase_Mtr_Task
ENDIF.

IF.Ctrls=2                     ;Right Output Phase
    R.0.TonePhase=Ctrl2
ENDIF.

;Ctrl3 Phase Offset handler not needed

IF.Ctrls=4             ;Btn0
    IF.Btn0=0
        Btn0="Arbitrary Freqency"
    ELSE.
        Btn0="Spectral Line Lock"
        S=SmplRate?X / 1024    ;Line step size
        IF.Ctrl0=<S                    ;Freq too low?
            Ctrl0=S                        ;Set min = step if so
        ENDIF.
        L.0.ToneFreq=cint(Ctrl0 / S) * S   ;Nearest line freq
        Ctrl0=L.0.ToneFreq                 ;Set Left Out (Ref)
        R.0.ToneFreq=Ctrl0                 ;Set Right Out
    ENDIF.
ENDIF.

IF.Ctrls=5                ;Btn1 = Plot to File
    IF.Btn1=1                      ;Initial click-on?
        IF.Field1=                     ;File name present?
            Msg="Enter File Name in Field1"    ;Prompt for it if not
            Btn1=0                     ;Release Btn1
        ELSE.
            Msg=                       ;Clear prompt, if any
            Notes=Notes +"File Start: "+t  ;Save start time
            Buf3#N=1                   ;Prepare to save 1 buffer
            Buf3#Rf=1/K                ;Effective file sample rate
            Buf0#Vf=V                  ;File vertical range
            Buf0#Uf=UU(A)              ;File units (Deg/Rad)
            A.Buf3="<SaveDQA:" + Field1    ;Save initial buffer
            UC=1024                    ;Countdown for next save
            Ctrl1="<D"                 ;Disable update rate change
        ENDIF.
    ELSE.                          ;Else click-off to end file
        Notes=Notes +n +"File End:  "+t    ;Save end time
        Buf3#N=1                       ;Save final buffer as above
        Buf3#Rf=1/K
        Buf0#Vf=V
        Buf0#Uf=UU(A)
        Buf3#SO=UC                     ;Partial buffer start index
        A.Buf3="<SAveDQA:" + Field1    ;Append final buffer
        Ctrl1="<N"                     ;Enable update rate change
    ENDIF.
ENDIF.

IF.Ctrls=6                 ;Btn2 = Data Logging
    IF.Btn2=1                  ;Initial click-on?
        IF.Field1=                 ;File name present?
            Msg="Enter File Name in Field1"    ;Prompt for it if not
            Btn2=0                     ;Release Btn2
        ELSE.
            Msg=                       ;Clear prompt, if any
            A.LogName=Field1           ;Set logfile name
        ENDIF.
    ENDIF.
ENDIF.

IF.Ctrls=7             ;Btn3 = Averager on/off
    IF.Btn3=0              ;Going off?
        Avg=0
    ELSE.                  ;Going on
        Trig=1           ;Triggered for average
        IF.Spect=1       ;Spectrum on?
            Spect=0            ;Waveform display if so
            Avg=1              ;Start wave average
            Spect=1            ;Back to Spectrum
        ELSE.                ;Waveform display
            Avg=1              ;Start average
        ENDIF.
    ENDIF.
ENDIF.

IF.Ctrls=8
    IF.Key?$=1
    AND.Btn4&1=0
        Btn4=(Btn4 - 1)&3
        GenDlg=1
        GenWavL=1
        Stream=3
    ELSE.
        IF.Btn4=0
            Btn4="External Inputs"
        ENDIF.
        IF.Btn4=1
            Btn4="External Inputs + Phase Mod"
        ENDIF.
        IF.Btn4=2
            Btn4="Internal Test"
        ENDIF.
        IF.Btn4=3
            Btn4="Internal Test + Phase Mod"
        ENDIF.
        IF.Btn4&1=1
            R.0.TonePhase=Ctrl2
            R.0.PM=1
            Msg="CTRL+Click for Phase Modulation controls"
        ELSE.
            R.0.PM=0
            Msg=
        ENDIF.
    ENDIF.
ENDIF.

IF.Ctrls=9                     ;Btn5 = Degrees/Radians
    IF.Btn5=0
        Btn5="Degrees"
        Mtr0="<<Phase - Degrees"
        V=180                          ;Vertical range to be set
        UU="Deg"                       ;Units be set
    ELSE.
        Btn5="Radians"
        Mtr0="<<Phase - Radians"
        V=pi
        UU="Rad"
    ENDIF.
    Label3=UU(A)                       ;Show units
    IF.UR=>0                           ;Plotting active?
        Buf0#V=V                           ;Set vertical range
        Buf0#U=UU(A)                       ;Set units
    ENDIF.
ENDIF.

IF.Ctrls=10            ;Btn6 = Show Inputs
    LI.Disp=Btn6           ;Set channel states to Btn6 state
    RI.Disp=Btn6
    UN=0                   ;Reset plot X-axis timer
    UK=0
    N=Time
ENDIF.

IF.Ctrls=11                ;Btn5 = Show Meter
    IF.Btn7=0
        Mtr0=
    ELSE.
        Mtr0="<H4905"
    ENDIF.
    UN=0                   ;Reset plot X-axis timer
    UK=0
    N=Time
ENDIF.
_Phase_Mtr_Task Macro Listing:
;<Help=H4905
UX=(Btn4+1)&2                  ;0 for Btn4=0 or 2, =2 for 1 or 3
IF.Avg=0                       ;Averager off?
    Buf0="<=W(UX)"             ;Get raw Ref wave
    Buf1="<=W(UX+1)"           ;Raw signal wave
ELSE.                          ;Else Avg on
    Buf0="<=a(UX)"             ;Get avg Ref wave
    Buf1="<=a(UX+1)"           ;Avg signal wave
ENDIF.
Buf0="<*(65536)"               ;Scale up for FFT
Buf1="<*(65536)"
IF.SpectWindOn=1           ;Use spectral window?
    Buf0="<FB0"                ;Windowed Ref FFT
    Buf1="<FB1"                    ;Windowed signal FFT
ELSE.                          ;Else no window
    Buf0="<fB0"                ;Unwindowed Ref FFT
    Buf1="<fB1"                    ;Unwindowed signal FFT
ENDIF.
Buf2="<mB0"                ;Magnitude spectrum of Ref
UP=pkb(2)                  ;Find peak value in Buf2
UP=Posn?p                  ;Index of peak
E=Buf0[2*UP]                   ;Ref peak real component
I=Buf0[2*UP+1]                 ;Ref peak imaginary component
P=atan(I,E)*360/(2*pi)     ;Ref phase (re: FFT start)
E=Buf1[2*UP]                   ;Signal peak real
I=Buf1[2*UP+1]                 ;Signal peak imaginary
Q=atan(I,E)*360/(2*pi)         ;Signal phase
D=P-Q-Ctrl3                    ;Phase difference, w. Offset
IF.D=<0                        ;Force 0-360 range if neg
    D=360+D
ENDIF.
IF.D=>180                      ;Force +/-180 range
    D=D-360
ENDIF.
IF.Btn5=1                      ;Radians for meter?
    M=D*2*pi/360                   ;Degrees to radians
ELSE.
    M=D                            ;Else meter = degrees
ENDIF.

Field3=M(0.4)                  ;Copy of meter to Field3

IF.Btn7=1                      ;Meter on?
    Mtr0=M(0.4)                ;Show if so
ENDIF.

IF.UR=>0
    IF.U1+UT=0                 ;Interval mode?
        Q=Time<<32/10M         ;Current time
        IF.Q=>T                    ;Past target?
            T=T+R                      ;Next target
            @_Phase_Mtr_Update         ;Update plot/log
        ENDIF.
    ELSE.                      ;Time mode
        Q=int(Time<<32/10M/R)      ;Most-recent integer time step
        IF.Q=>X                    ;Past last time step?
            X=Q                        ;Save for next test if so
            @_Phase_Mtr_Update         ;Update plot/log
        ENDIF.
    ENDIF.
ENDIF.
_Phase_Mtr_Update Macro Listing:
;<Help=H4905
Buf3="<+(Z)"                   ;Remove Zero offset
Buf3="<<B3"                    ;Scroll left
Buf3[1023]=D * 32767 / 180     ;New right end pt

IF.Key?#="z"                       ;"z" key hit?
    ZeroScrn=Buf3[CursN] / 327.68  ;Zero=Curs posn value
ENDIF.

Z=ZeroScrn * Zero * 327.68     ;Z = offset, if Zero on
Buf3="<-(Z)"                   ;Apply offset

IF.Btn2=1                      ;Data logging on?
    LogTxt=n + t +p20 + M      ;Save time and meter value
ENDIF.

IF.Btn1=1                      ;Plot to file?
    UC=UC-1                        ;Count the point
    IF.UC=<=0                      ;Countdown complete?
        Buf3#N=1                       ;Prepare to save 1 buffer
        Buf3#Rf=1/K                    ;Effective file sample rate
        Buf0#Vf=V                      ;File vertical range
        Buf0#Uf=UU(A)                  ;File units (Deg/Rad)
        A.Buf3="<SAveDQA:" + Field1    ;Save current buffer
        UC=1024                        ;Countdown for next save
    ENDIF.
ENDIF.

IF.UR=<3                           ;Fast update interval? (0.01 or 0.02)
    UN=UN+1                            ;Count the point
    IF.UN=>10                          ;More than 10 points?
        L=(Time-N)<<32/10M / UN            ;Avg update interval
        IF.UK=0                            ;1st value since change?
            K=L                                ;Initialize avg
            UK=1                               ;Flag = Init done
        ENDIF.
        K=K+(L-K) / 100                    ;Running avg with TC=100
        Field2=K(0.4)                      ;Show avg
        UN=0                               ;Reset timer count
        N=Time
        Buf0#R=1/K                         ;Set X-axis effective rate
    ENDIF.
ENDIF.
See also Macro Examples and Mini-Apps, Chart Recorder Mini-App, Lissajous (X vs. Y) Mini-App
- Back to File Navigator Mini-App
- Ahead to DaquinOscope Mini-App
- Daqarta Help Contents
- Daqarta Help Index
- Daqarta Downloads
- Daqarta Home Page
- Donate to Daqarta
Questions? Comments? Contact us!
We respond to ALL inquiries, typically within 24 hrs.INTERSTELLAR RESEARCH:
Over 45 Years of Innovative Instrumentation
© Copyright 2007 - 2026 by Interstellar Research
All rights reserved